Dislocations in graphene: the importance of 3D buckling
The birth and death of a dislocation - its full life cycle

 Download the print version.
June 28, 2013 - The central role of dislocations in determining the behavior of solid-state matter has been extensively investigated in materials sciences since the first mathematical formulation [1] of the dislocation concept at the beginning of the twentieth century, and the description of the physical mechanism, e.g. [2], as well as their experimental discovery for TEM [3]. However, up until now, atomic-scale studies of creation, migration and annihilation of dislocations have been reserved for theory and atomistic simulations, as monitoring changes in the structure of materials with atomic resolution has been well beyond the spatial and temporal limits of experimental characterization techniques. The conventional transmission electron microscope has proven to be the only tool for direct studying of the structure of dislocations back to the seminal work laid out by Cockayne et al. in 1969 [4] by the introduction of the weak beam method, a revolutionary technique at that time allowing for the first time imaging a dislocation by its surrounding tiny strain field, using a defined but weakly excited beam [4]. However, due to the two-dimensional nature of graphene, and thanks to the first practical realization of aberration correction (AC) for TEM [5,6], their further technology advancement and results [7–8], with a Cs-corrected FEI Titan 80-300 operated at 80 kV we were capable to image the dynamic of dislocations atom-by-atom [9], from birth to annihilation. For example, see AC-HRTEM image sequences showing the birth (see Supplementary Movie 1) and the annihilation (see Supplementary Movie 4) of dislocations in graphene. For more detail information about the atomic scale study of the life cycle of dislocations in graphene from birth to annihilation, see inside the resource document Fig. 1 and Fig. 5 by Lethinen et al. 2013, Nature Communications, 4, Article Number 2098, doi: 10.1038/ncomms3098. Here we discuss the central importance of the 3D buckling calculation for graphene research - from flat to buckled surface.
Out-of-plane buckling in strained two-dimensional materials so far only a hypothesis
However, the two-dimensionality, also introduces peculiarities as there are no neighboring atomic planes inhibiting out-of-plane deformations, the presence of dislocations with their associated strain fields may lead to strong out-of-plane corrugations. This can be readily illustrated by considering a plain sheet of paper: try to compress it in the in-plane direction or perhaps pinch it in the center, and it will most certainly not get smaller, but will rather buckle. The importance of three-dimensional (3D) buckling in strained 2D materials has been pointed out earlier, e.g. [10–13]. However, as accounting for 3D out-of-plane deformations significantly complicates calculations [10], such deformations have either been omitted in theoretical studies, or the studied systems have been too small to describe the long-range corrugations, e.g. [14–18].
How we have imaged the full life cycle of a dislocation
In order to follow the whole life cycle of a dislocation atom-by-atom, we have here employed aberration-corrected high-resolution TEM using the electron beam both to image the dynamics of atoms in a suspended single-layer graphene sheet and to stimulate atomic-level structural changes In our experiment, we used an operating voltage of 80 kV, which is below the static sputtering threshold in graphene. However, thermal vibrations lead to non-zero displacement cross-section and therefore allow occasional sputtering [19]. As the structural changes were of specific interest in our experiment, we increased the temporal frequency of the transformation events by working at exceptionally high beam currents (up to 1x10⁸ e nm-2 s-1, that is, one to two orders of magnitude higher than what is typically used for purely structural investigations).
Strong long-range interaction between dislocations mediated by out-of-plane buckling
We found that the dislocations are first formed by sputtering carbon atoms by the energetic electrons, followed by reorganization of the vacancy agglomerates. The dislocations are seen to migrate either via bond rotations or further sputtering of atoms. We observe a markedly long-ranging interaction of the dislocations, and found that it is mediated by strong out-of-plane buckling of graphene, rather than in-plane strain as assumed previously. Owing to an attractive force acting between the dislocation cores, the cores are driven towards each other, ultimately resulting in the annihilation of the defects. As a whole, these observations comprise the first atomic-scale observation of the full life cycle of dislocations in any material.
How we found out-of-plane buckling
1. Calculation details
In order to predict the effect of the removal of the string of atoms on the structure of graphene, we conducted conjugate gradient structural relaxations of a large graphene supercell (~25x25 nm2 and ~24,000 atoms) containing a dislocation dipole in various configurations, employing an analytical force field [20] to describe the C-C interactions. However, as the stress required to stretch the surrounding exceedingly large graphene sheet is very small and the compressional strain can be released via out-of-plane corrugations (the energy constants characterizing in-plane and flexural stiffness differ by two orders of magnitude [21]), the width of the system was set to such a value that strain across the dislocation dipole is zero and the graphene sheet was allowed to buckle. Counter-intuitively, the damaged parts where the atoms were removed stay close to the pristine state, whereas the rest of the sheet is buckled, with slowly fading out-of-plane deformations extending over large distances. In the calculations, always two oppositely oriented dislocation cores were placed with different glide and climb distances, and the resulting structures were relaxed using the conjugate gradient algorithm as implemented in the in-house code Relaxat. Similar approach has earlier been applied to modeling strained carbon systems, e.g. [11]. In the displacement threshold calculation the interatomic forces were described via the density functional-based tight binding formalism [23]. In these molecular dynamic simulations, the atom of interest was assigned momentum in the normal direction relative to the graphene sheet and after the simulation time of 300 fs, it was determined whether the atom was detached from rest of the structure. A binary search algorithm was used to pinpoint the threshold energy. The simulated system consisted of 152 carbon atoms, with two dislocations separated by five climb steps at zero glide distance. A single k-point was used for the calculations and the simulation was run at 0K.

2. Energy landscape between the dislocations suggesting 2 forms of buckling
If the corrugations of two dislocation cores pointing towards each other (that is, originating from different dipoles) overlap, they can terminate each other. To study how this affects the energetics of the system, the potential energy of the system was mapped as a function of glide and climb distance of the cores. The resulting energy landscape is shown in Figure 1, with each point normalized to the number of atoms. Towards the lower left corner, the dislocations come closer to each other. Going up in the map means increasing the climb distance (and the number of atoms), whereas going right means increasing the glide distance. As bond rotations happen much more frequently than sputtering, dislocations can easily migrate towards energy minimum in the horizontal direction for any given vertical climb distance. The general trend in the energy map is clear: the closer the dislocations come, the lower the energy becomes, resulting in attractive force acting between the dislocations over large distances. The cores now effectively form a dislocation dipole with a row of extra atoms in-between them. The buckling can take place in different modes, depending on whether the individual dislocations are extended out of the plane in the same or opposite directions. These modes are presented in Fig. 1c and d, where the symmetrical extension is named the S mode, and anti-symmetrical one the AS mode. The energetics change depending on which mode is taking place (see Fig. 1b, where the energy is plotted at a fixed climb distance of 1.7 nm). The system finds its global energy minimum in the S mode at zero glide distance, and the energy in this mode increases monotonously with increasing glide distance. The AS mode has significantly higher energy at small glide distances, but as the distance increases, the energy goes down, and the mode becomes energetically favorable after a certain crossing point, the location of which depends on the climb distance. The AS mode has an energy minimum at a location that depends on the climb distance (1.2 nm for the presented case), after which the energy starts to increase, leading to an attractive force also in this mode. As is shown later, in the experiment, the dislocations tend to reside exactly at the distance where the energy minimum is predicted to be.

The importance of dislocations and TEM
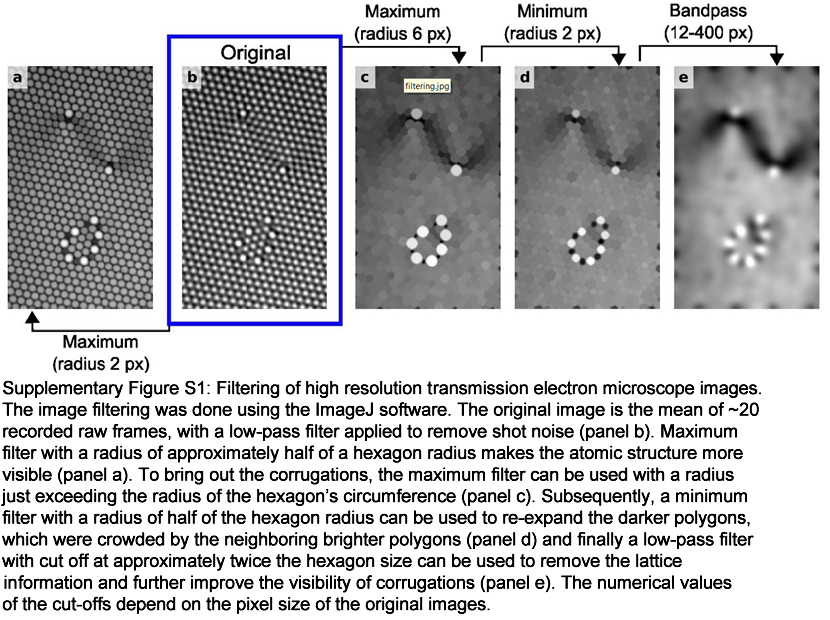
The calculated significant out-of-plane buckling was confirmed by our experiments. Traditionally, TEM is considered to be insensitive to 3D features of a sample, due to the inherently wide depth of focus of the instrument. However, in an AC-HRTEM image, the brightness of the center of a carbon polygon is sensitive to its projected size. This means that if a polygon is tilted, for example, due to a corrugation, its center becomes less bright. Compared to the lattice contrast, these variations are small, and hence they are not clearly visible without image processing. However, by applying maximum filtering on the digital images, where the brightest pixels are expanded to cover their neighborhood up to a predefined radius, the variations in the polygon brightnesses can be amplified (see in the paper's supplementary materials the Figure S1 for details). Similar information can be extracted using geometrical phase analysis, as was demonstrated recently by Ortolani et al. 2012 [22]. However, the interpretation of geometrical phase analysis results is biased towards reading the apparent reduction in bond lengths as compression rather than tilting, as in a previous study [24], where as high as 27% compression of bonds was reported next to the dislocation cores. Figure 2a shows an AC-HRTEM micrograph of two interacting dislocation cores. Panel b presents the same image after processing. A clearly visible dark ridge connecting the dislocation cores is observable, indicating a reduced projected size of the polygons along that line. This can be attributed either to corrugations or compressive strain, as both of them reduce the projected size of the polygons.
Two scenarios
Buckled structure or strained flat structure between the dislocation cores. To identify which scenario takes place in the experiment, the same dislocation configuration was relaxed first by allowing the structure to buckle and next by constraining the geometry to be flat. Evaluation of the buckled structure: Relaxation of the buckled structure resulted in the corrugated structure visualized in Fig. 2d. The structure was subsequently used for HRTEM image simulation. Applying identical filtering as was used for the experimental image resulted in strikingly similar features as compared with the experiment (Fig. 2e).
Evaluation of the flat strained systems
The total energy of the flat relaxed system is 17 eV higher than in the previous buckled case. Further on, its simulated and filtered image (Fig. 2g) proved to be in disagreement with the experimental one. Most importantly, the dark ridge connecting the dislocations is absent. Similar simulated image to Fig. 2e would result from a flat atomic structure with the same in-plane coordinates as in the buckled structure. The total energy of such a configuration ends up 145 eV higher in our simulation, however.
Thus, the contrast observed in the experimental image can be considered arising due to out-of-plane buckling of the graphene sheet rather than bond contraction, and the corrugations in the experiment follow the prediction of the simulations.
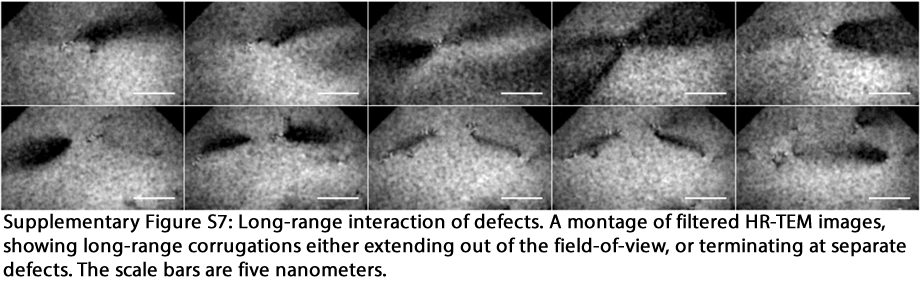
The markedly long-range nature of the corrugation-mediated interactions of dislocations and other defects can be observed in Fig. 2c. The dark ridge extends over the length of 7 nm terminating at separate defects. More examples with even longer ranges are presented in Supplementary Figure S7 and Supplementary Movie 3. One can further conclude that even at fairly low concentrations, point defects in graphene can no longer be considered isolated. Instead they form an interconnected network, as the strain fields or 'corrugation fields' of interacting defects strongly affect the energetics of the system.
Resource: Lethinen, O., Kurasch, S., Krasheninnikov, A. V., & Kaiser, U. (2013), Atomic scale study of the life cycle of a dislocation in graphene from birth to annihilation. Nature Communications, 4: 2098, doi: 10.1038/ncomms3098, [PDF], see also the Supplementary Information
-
Volterra, V. (1905). Sull'equilibrio dei corpi elastici più volte connessi. (In English: On the equilibrium of elastic bodies repeatedly connected.) Il Nuovo Cimento (1901-1910), 10: 361-385, doi: 10.1007/BF02718897.
-
Burgers, J. M. (1939), Some considerations of the field of stress connected with dislocations in regular crystal lattice. K. Ned. Akad. Wet, 42: 293-325 (Part I), 378-399 (Part II).
-
Hirsch, P., Cockayne, D., Spence, J. & Whelan, M., (2006), 50 years of TEM of dislocations: past, present and future. Philos. Mag., 86: 4519-4528, doi: 10.1080/14786430600768634.
-
Cockayne, D. J. H., Ray, I. L. F. & Whelan, M. J. (1969), Investigations of dislocation strain fields using weak beams. Philos. Mag., 20: 1265-1270, doi: 10.1080/14786436908228210.
-
Haider, M., & Uhlemann, S., (1997). Seeing is not always believing: Reduction of artefacts by an improved point resolution with a spherical aberration corrected 200 kV TEM. Microscopy & Microanalysis, 3: 1179-1180.
-
Haider, M., Uhlemann, S., Schwan, E., Rose, H., Kabius, B., & Urban, K. W. (1998), Electron microscopy image enhanced. Nature, 392: 768-769, doi: 10.1038/33823
-
Hartel, P., Muller, H., Uhlemann, S., & Haider, M. (2007a), Experimental set-up of an advanced hexapole Cs-corrector. Microscopy & Microanalysis, 13: 1148-1149, doi: 10.1017/S1431927607072777
-
Hartel, P., Muller, H., Uhlemann, S., & Haider, M. (2007b), First experimental results with advanced hexapole Cs-corrector. Microscopy & Microanalysis, 13: 4-5, doi: 10.1017/S1431927607080026
-
Kurasch, S., Kotakoski, J., Lehtinen, O., Skákalová, V., Smet, J., Krill III, C. E., Krasheninnikov, A. V., & Kaiser, U. (2012). Atom-by-atom observation of grain boundary migration in graphene. Nano letters, 12: 3168-3173, doi: 10.1021/nl301141g
-
Guinea, F., Horovitz, B. & Le Doussal, P. (2008), Gauge field induced by ripples in graphene. Phys. Rev. B, 77: 205421, doi: 10.1103/PhysRevB.77.205421
-
Chen, S., Ertekin, E. & Chrzan, D. C. (2010), Plasticity in carbon nanotubes: Cooperative conservative dislocation motion. Phys. Rev. B, 81: 155417, doi: 10.1103/PhysRevB.81.155417
-
Liu, T.-H., Gajewski, G., Pao, C.-W. & Chang, C.-C. (2011), Structure, energy, and structural transformations of graphene grain boundaries from atomistic simulations. Carbon, 49: 2306-2317, doi: 10.1016/j.carbon.2011.01.063
-
Yazyev, O. V. (2012), Polycrystalline graphene: atomic structure, energetics and transport properties. Solid State Commun., 152. 1431-1436, doi: 10.1016/j.ssc.2012.04.045
-
Lee, S. & Hwang, G. S. (2011), Valence force field-based monte carlo bond-rotation method for the determination of sp2-bonded carbon structures. J. Appl. Phys., 110: 093524, doi: 10.1063/1.3660383
-
Carpio, A. & Bonilla, L. L. (2008) Periodized discrete elasticity models for defects in graphene. Phys. Rev. B, 78: 085406, doi: 10.1103/PhysRevB.78.085406
-
Ariza, M. & Ortiz, M. (2010) Discrete dislocations in graphene. J. Mech. Phys. Solids, 58: 710-734, doi: 10.1016/j.jmps.2010.02.008
-
Jeong, B. W., Ihm, J. & Lee, G.-D. (2008) Stability of dislocation defect with two pentagon-heptagon pairs in graphene. Phys. Rev. B, 78: 165403, doi: 10.1103/PhysRevB.78.165403
-
Zhang, H.-L., Wang, S.-F., Wang, R. & Jiao, J. (2010), The dislocations in graphene with the correction from lattice effect. Eur. Phys. J. B, 73: 489-493, doi: 10.1140/epjb/e2010-00019-4
Meyer, J. C., S. Kurasch, H. J. Park, V. Skakalova, D. Kunzel, A. Gross, A. Chuvilin, G. Algara-Siller, S. Roth, T. Iwasaki, U. Starke, J. Smet, & U. Kaiser (2012), Accurate measurement of electron beam induced displacement cross sections for single-layer graphene. Phys. Rev. Lett., 108: 196102, doi: 10.1103/PhysRevLett.108.196102
-
Brenner, D. W., Shenderova, O. A., Harrison, J. A., Stuart, S. J., Ni, B., & Sinnott, S. B. (2002), A second-generation reactive empirical bond order (rebo) potential energy expression for hydrocarbons. J. Phys. Condens. Matter, 14: 783, doi: 10.1088/0953-8984/14/4/312
-
Yakobson, B. I., Brabec, C. J. & Bernholc, J. (1996), Nanomechanics of carbon tubes: instabilities beyond linear response. Phys. Rev. Lett., 76: 2511-2514.
Ortolani, L., Cadelano, E., Veronese, G. P., Boschi, C. D. E., Snoeck, E., Colombo, L., Morandi, V. (2012), Folded graphene membranes: Mapping curvature at the nanoscale. Nano. Lett., 12: 5207-5212, doi: 10.1021/nl3023737
-
Porezag, D., Frauenheim, T., Kohler, T., Seifert, G. & Kaschner, R. (1995) Construction of tight-binding-like potentials on the basis of density-functional theory: application to carbon Phys. Rev. B, 51: 12947, doi: 10.1103/PhysRevB.51.12947
-
Warner, J. H., Margine, E. R., Mukai, M., Robertson, A. W., Giustino, F., & Kirkland, A. I. (2012). Dislocation-driven deformations in graphene. Science, 337: 209-212, doi: 10.1126/science.1217529